19 Jul 2026
Variance Mapping Techniques for Video Poker Variants in Session Strategy Development
 Experts track variance patterns in video poker by measuring how far actual returns deviate from expected values over thousands of hands, and this data helps shape session plans that match bankroll size to game volatility. Different variants produce distinct swing profiles because their pay tables reward rare hands at varying frequencies, so players review historical outcome distributions before selecting a title for extended play. Jacks or Better machines with full-pay tables post moderate variance since four-of-a-kind and straight flush hits occur often enough to smooth bankroll movement, whereas Deuces Wild versions generate higher variance when wild cards create more frequent but uneven payouts. Observers note that Double Double Bonus Poker pushes variance further because the bonus structure for four aces or four deuces with kickers inflates top-end returns while leaving more common hands with smaller rewards.
Calculating Variance Across Pay Tables
Researchers calculate variance by multiplying each hand's probability by the square of its deviation from the mean return, then summing those products; the resulting figure quantifies expected fluctuation per hand. Data from multi-hand machines shows that 10-play formats compress variance slightly compared with single-hand versions because simultaneous outcomes average toward the mean more quickly, yet the underlying pay table still dictates the dominant swing pattern.
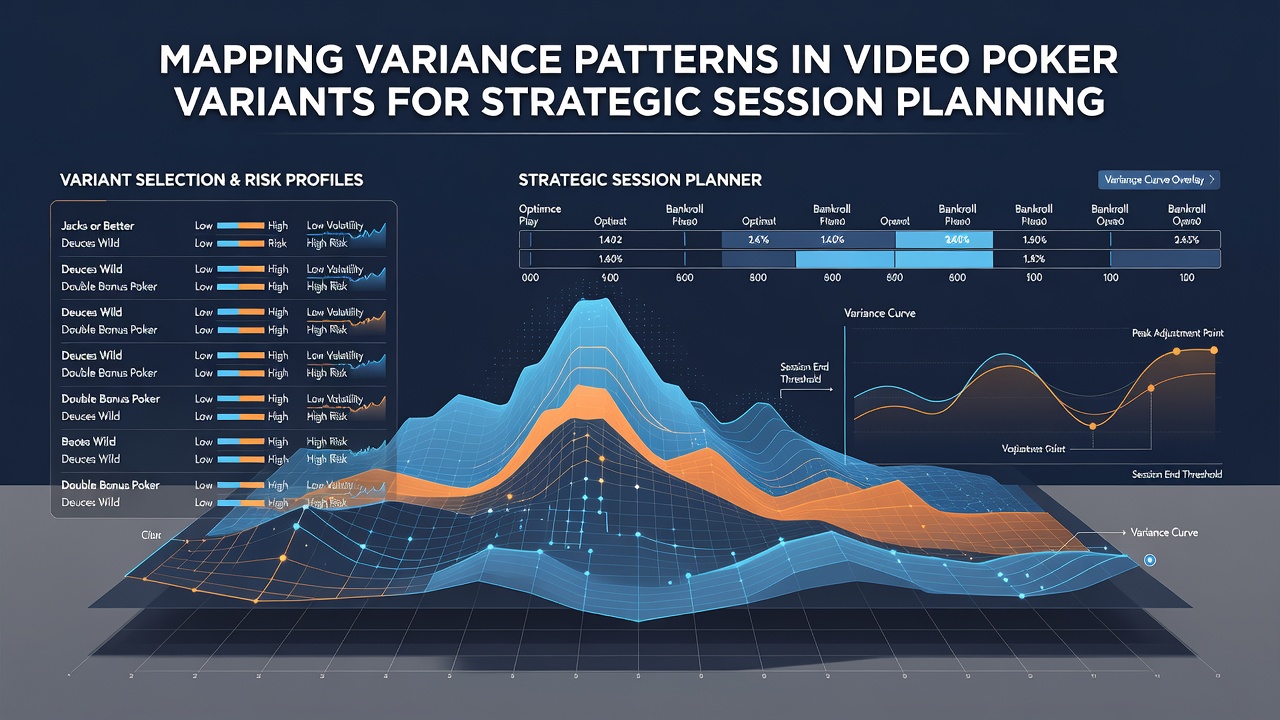
Analysts compare these numbers across titles to identify which variants stay within tighter ranges during short sessions and which ones produce wider swings that require larger reserves. Software packages used by serious players import pay table data and simulate millions of hands to output variance curves that plot cumulative bankroll paths under different bet sizes.
Applying Patterns to Session Length and Bet Sizing
Once variance figures are mapped, planners adjust maximum session length so that the probability of exhausting a set bankroll stays below a chosen threshold. Lower-variance games permit longer continuous play because drawdowns remain shallower, while higher-variance titles call for shorter blocks separated by breaks that reset mental accounting.
Bet sizing follows the same mapping process; participants reduce unit size on high-variance variants to keep total exposure proportional to available funds. Studies from the University of Nevada's gaming research center illustrate that sessions planned around these adjusted stakes maintain positive expected value even when short-term results fall below the long-run return percentage.
Regional Data Sources and July 2026 Updates
Figures released by the Nevada Gaming Control Board in July 2026 confirm that video poker continues to represent a steady share of total win despite competition from newer slot products, and those same reports supply aggregate hold percentages that feed into variance models. Industry groups such as the American Gaming Association publish quarterly summaries that include machine-level performance metrics useful for cross-checking simulation outputs against real-floor results.
Academic papers from institutions in Australia and Canada add comparative data on regional rule differences that alter variance slightly, for instance through changes in progressive jackpot contributions or bonus round frequencies. Planners combine these sources to refine maps that remain accurate across jurisdictions.
Practical Mapping Workflow
Session planners begin by listing target variants and recording each pay table's exact returns for every hand rank. They then run Monte Carlo simulations that generate outcome sequences matching the calculated probabilities, after which variance statistics are extracted from the resulting datasets. Charts produced from these runs display the percentage of sessions that finish above or below starting bankroll at incremental hand counts, giving concrete benchmarks for deciding when to stop or switch games.
Players who follow this workflow often discover that certain mid-variance hybrids offer a workable compromise between session duration and excitement level, allowing bankrolls to support extended visits without extreme exposure. Continuous monitoring of actual results against mapped projections further refines future plans as more hands are recorded.
Conclusion
Mapping variance patterns supplies a factual framework that converts raw pay table data into actionable session parameters across video poker variants. When planners apply these measurements consistently, bankroll allocation aligns with each game's documented swing characteristics, supporting longer-term participation without reliance on short-term outcome predictions.