17 Jul 2026
Tracking Bookmaker Line Adjustments Across Tournament Seasons
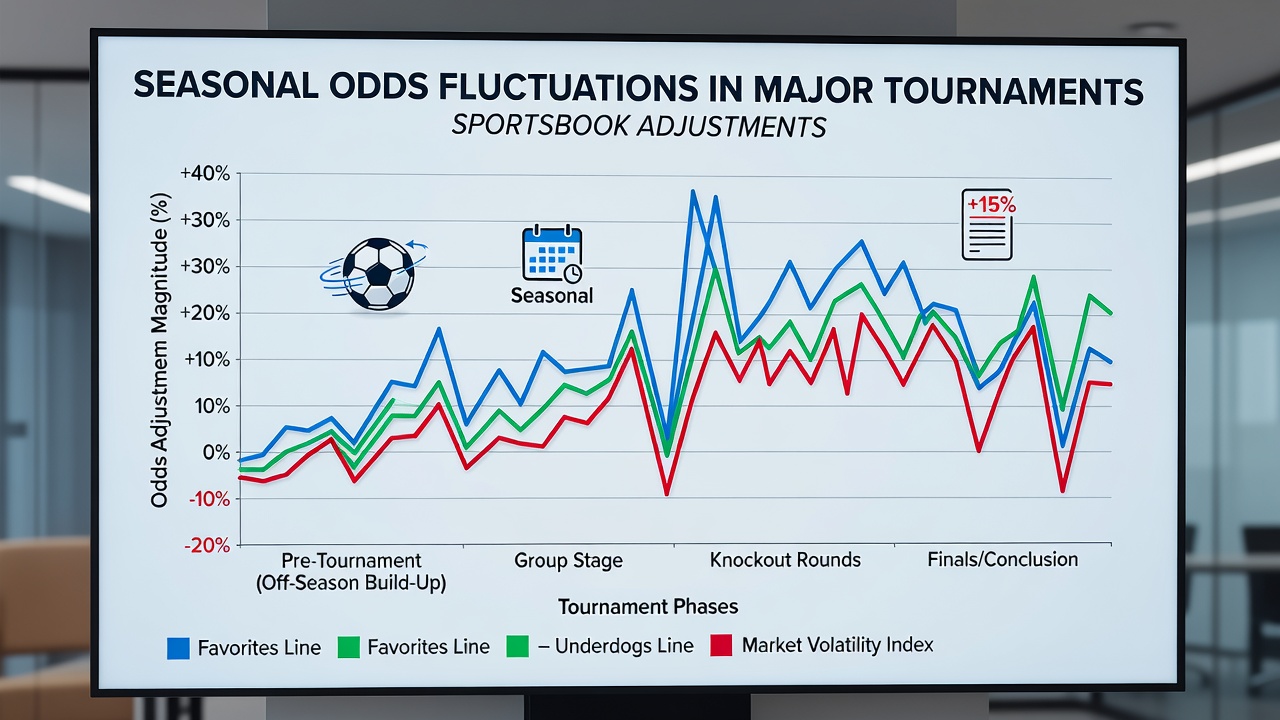 Sportsbooks recalibrate their offerings throughout the calendar as major international tournaments unfold in distinct phases, and data from betting exchanges shows these recalibrations follow recurring patterns tied to pre-event anticipation, live competition, and post-event settlement. Researchers at several universities have documented how lines on football, tennis, and Olympic events shift in measurable ways when global attention peaks during summer and winter cycles, while bookmakers incorporate real-time data feeds that alter probabilities within minutes of key developments.
Pre-Tournament Buildup and Early Adjustments
Bookmakers typically open markets months ahead of events such as the FIFA World Cup or the Olympic Games, yet the most pronounced movement occurs in the final six to eight weeks when qualification results, injury reports, and weather forecasts enter pricing models. Figures released by the Nevada Gaming Control Board indicate that handle on international football rises sharply in the May-to-July window, prompting operators to tighten margins on favorites while widening spreads on underdogs to balance liability across regions. Those who monitor exchange data note that early lines often reflect historical averages, but they diverge quickly once national team training camps begin and public money concentrates on home nations or star players.
In-Event Fluctuations During Peak Periods
Once tournaments commence, odds exhibit heightened volatility as live information overrides pre-match assumptions. During the group stages of major football competitions, for instance, a single draw or unexpected goal differential can trigger cascading revisions across related markets including player props and tournament winner futures. Studies conducted by academic teams in Australia have tracked these intra-day movements using timestamped data from multiple operators, revealing that lines on high-profile matches stabilize only after the first half concludes, whereas lower-profile fixtures retain wider ranges until final whistle. In July 2026, when several continental tournaments overlap with preparation cycles for upcoming global events, similar compression patterns appeared in tennis and cricket lines according to exchange volume records.
Regional and Seasonal Variations in Market Behavior
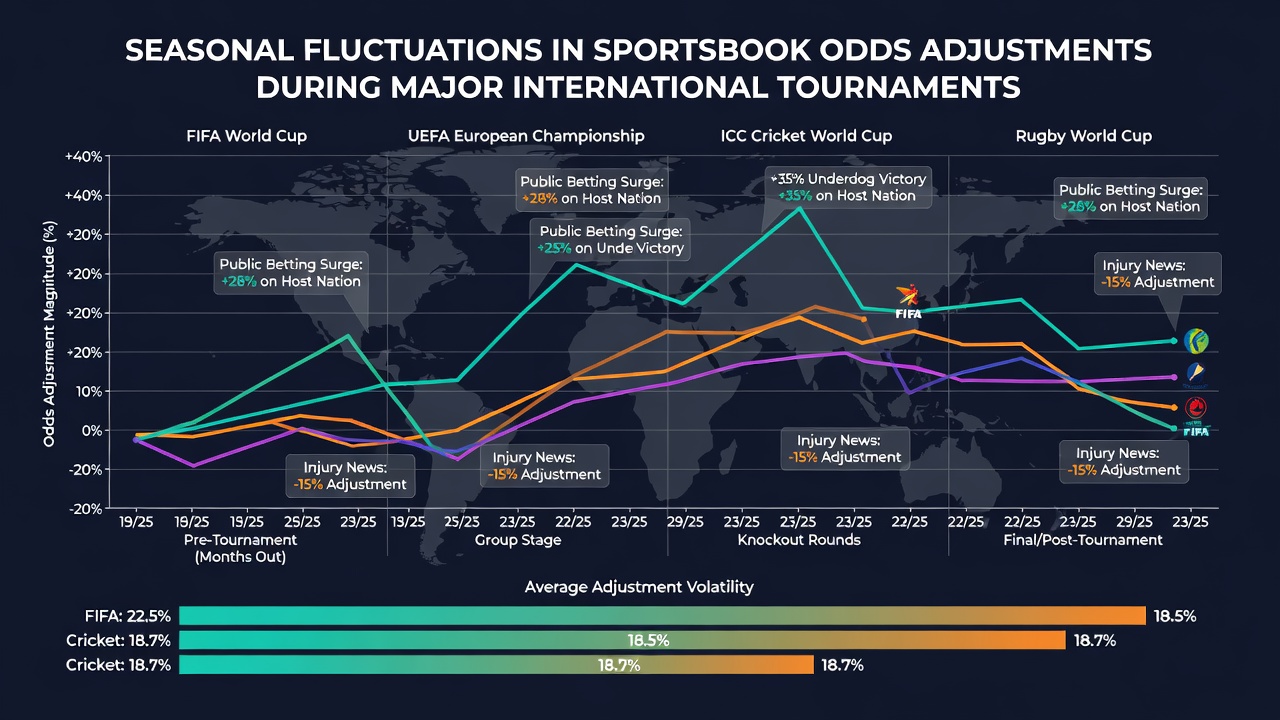
European operators historically tighten limits faster than North American counterparts during winter tournaments, whereas Australian and Asian books show accelerated movement on summer events because of time-zone overlap with local audiences. Data compiled by the European Gaming and Betting Association demonstrates that average margin reductions reach 12 to 15 percent on marquee matches during July and August compared with off-peak months, driven by increased liquidity and competition among platforms. Observers note that weather-dependent sports such as tennis and golf produce additional layers of adjustment, with rain delays or temperature swings prompting rapid revisions that propagate across correlated markets including set betting and over-under totals.
Data Sources and Measurement Approaches
Industry analysts rely on a combination of closing-line values, steam moves, and sharp-action indicators to quantify these seasonal shifts. A 2025 paper from researchers at the University of Sydney examined five years of tournament data and found that line movement magnitude correlates strongly with cumulative media coverage rather than pure team strength differentials alone. Regulatory filings from multiple jurisdictions further confirm that operators maintain internal dashboards tracking these patterns to manage risk across time zones, while public bettors encounter the downstream effects through shortened betting windows and adjusted maximum stakes once early money appears.
Conclusion
Seasonal charting of sportsbook adjustments reveals consistent rhythms across tournament calendars, with the steepest revisions clustered around qualification deadlines, opening ceremonies, and knockout thresholds. Market participants who review historical line graphs alongside volume statistics can identify recurring windows where liquidity surges and pricing models incorporate fresh inputs at accelerated rates. These patterns continue to evolve as data partnerships expand and regulatory frameworks in different regions standardize reporting requirements for major events.