30 Jun 2026
Examining Correlation Patterns Between Major Sporting Events and Virtual Gaming Platforms
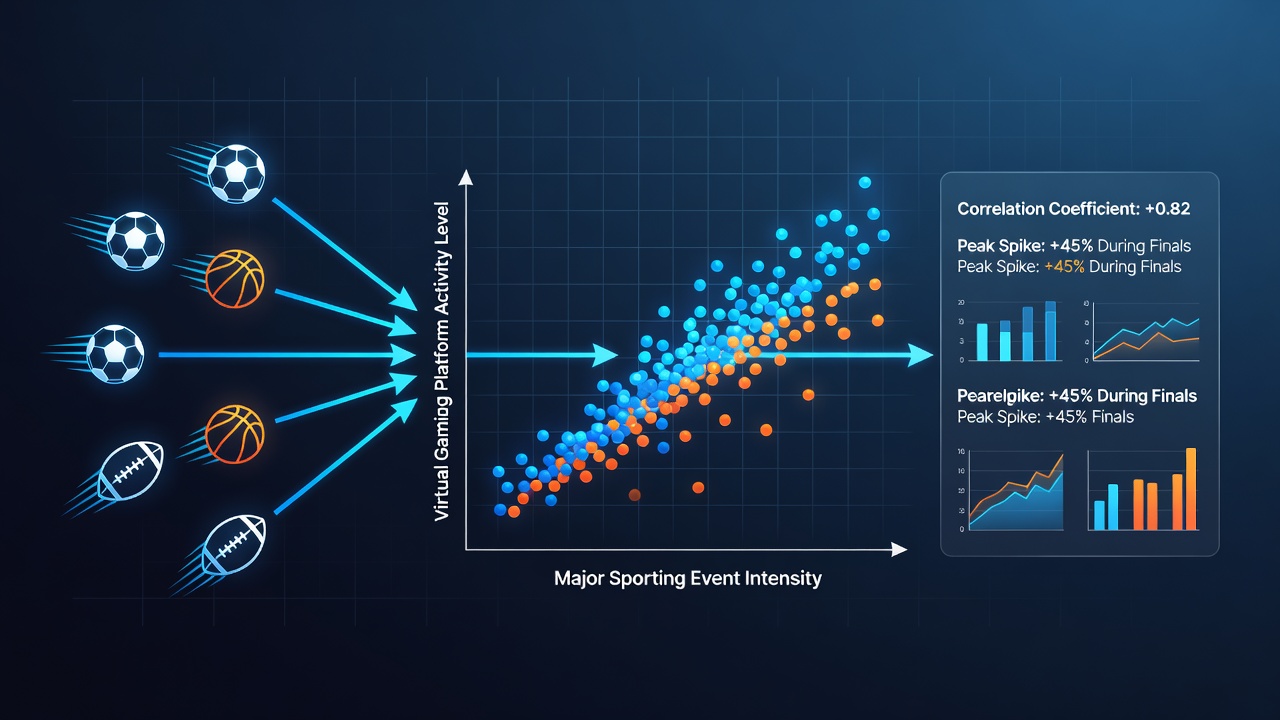
Analysts have tracked data from multiple regions that shows clear links between major sporting calendars and heightened engagement on virtual gaming sites, where login volumes, deposit activity, and session lengths rise during high-profile matches or tournaments. Researchers compile these figures from platform operators and payment processors, then cross-reference them against event schedules to identify repeatable patterns across different time zones and audience demographics.
Documented Activity Surges Across Event Types
Studies from North American operators reveal that the Super Bowl period consistently produces the largest single-day increases in online casino traffic, with some platforms reporting up to 35 percent more active users compared to average weekends. Similar patterns appear during the FIFA World Cup finals and UEFA Champions League knockout stages, where European markets show parallel growth in virtual slot and table game participation. These spikes occur because audiences already engaged with live sports often extend their screen time into adjacent entertainment options, and data sets from 2018 through 2024 confirm the correlation holds year after year.
June 2026 brings the expanded FIFA World Cup across North America, with matches scheduled from mid-June onward, and preliminary modeling by analytics firms projects comparable or larger activity lifts than those recorded in 2022. Payment flow records indicate that deposit methods popular among sports viewers, such as e-wallets and instant bank transfers, see accelerated usage on match days, while session durations lengthen by an average of twelve minutes during key fixtures.
Platform Responses and Feature Adjustments
Operators respond to these predictable windows by scheduling themed promotions and live-event integrations that align with ongoing competitions. Real-time leaderboards tied to match outcomes or bonus rounds triggered by goal celebrations appear on several major sites during tournament periods. Traffic monitoring tools used by these companies flag the precise hours when viewership peaks, allowing backend teams to allocate additional server capacity and customer support resources without disrupting regular operations.
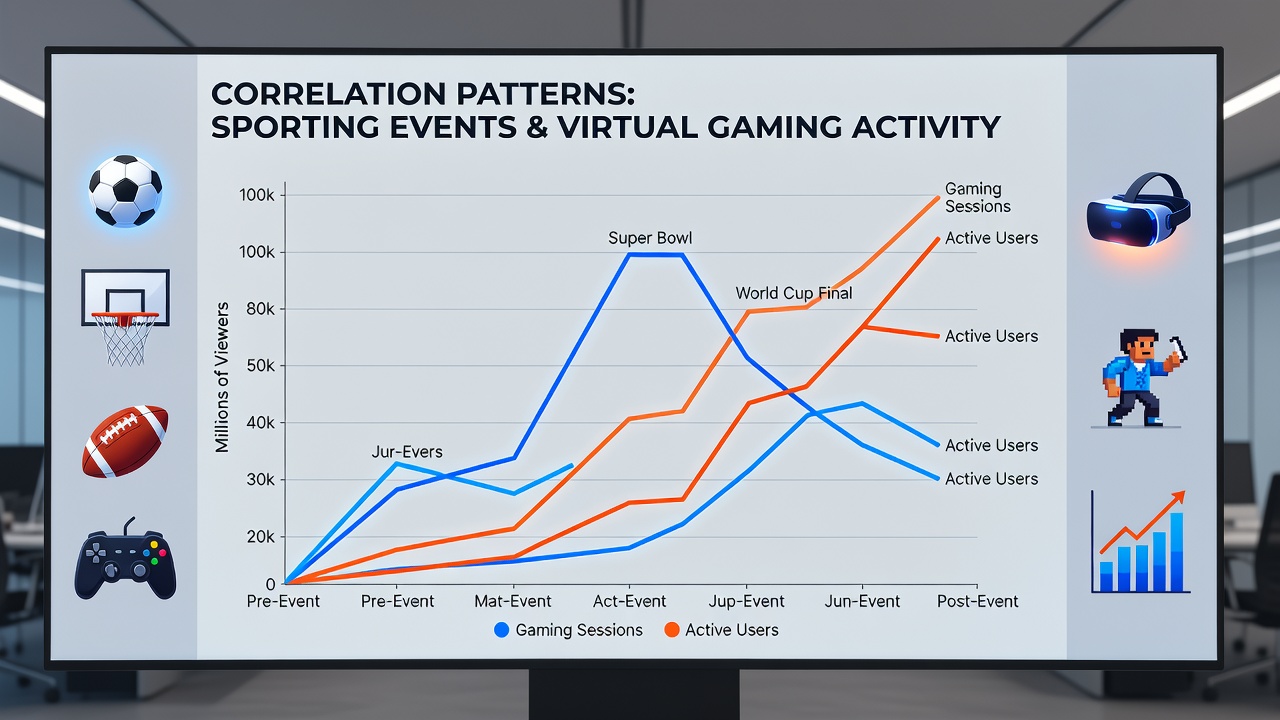
Regional regulators outside the United Kingdom track these trends through mandatory reporting requirements. The Nevada Gaming Control Board publishes quarterly summaries that separate sports wagering data from other online gaming categories, and these reports show overlapping growth curves during shared event windows. Australian state authorities similarly release aggregated figures through their respective gaming commissions, providing researchers with additional datasets that reinforce the same timing relationships observed elsewhere.
Analytical Approaches and Data Sources
Academic teams at institutions such as the University of Nevada, Las Vegas have examined anonymized transaction logs spanning several years to isolate the sporting-event variable from seasonal or promotional noise. Their published methodology uses regression models that control for marketing spend and new game releases, leaving event-driven effects as the primary explanatory factor. Industry groups like the European Gaming and Betting Association compile comparable statistics across member companies, creating larger sample sizes that reveal consistent percentage uplifts regardless of individual platform size.
Cross-border comparisons highlight slight variations by sport and geography. Basketball and soccer events generate broader international traffic than niche competitions, while North American audiences show stronger responses to playoff series than to regular-season games. Payment processor data from firms operating in multiple jurisdictions supplies the raw volume metrics that feed these models, allowing observers to quantify not only login counts but also average bet sizes and game-type preferences during peak windows.
Conclusion
Evidence assembled from regulatory filings, academic studies, and operator reports establishes measurable connections between major sporting calendars and elevated virtual gaming activity. As the 2026 FIFA World Cup approaches, analysts continue refining predictive models that draw on these established patterns, supplying operators with forward-looking estimates for infrastructure and compliance planning. The data sets remain publicly accessible through the cited regulatory and research channels, enabling ongoing verification as new events unfold.